
Picture that emotion.
Advertising is all about creating an emotional bond between a brand and consumers. And since the infancy of this discipline, both marketers and agencies have been trying to visualise this connection. Focus groups, vox pop, surveys, research… They all had a go at it. But personally I never got fully satisfied by them. As a matter of fact, I am not convinced that people give you access to their intrinsic beliefs when prompted over the phone or in the street.
Then Social Media arose. And you must admit that they are simply great for that corollary use. After all, what are these platforms but the depository of our intimate emotions?
So obviously you can have a quick peek at Facebook and look up for the fan pages for your brands. That is straightforward as people are overtly expressing their sentiment towards the brand through these pages. They revive dormant products and reenergise old brands. They also virtually stone others to death.
But what if you are interested in emotions more deeply engrained in consumer minds? And looking at visualising them? Personally I used to visit photo sites like Flickr and run a query on a given brand. Type Bailey’s for instance and you will get hundreds of pictures showing up. The resulting mosaic is fantastically enriching. You may well have pictures of people sipping their favourite liquor but also loads of pictures of dogs and cats named after that brand. What a better proof of brand engagement than to name your beloved pet after a trademark? Or to tattoo the swoosh on your hip?
Think outside the (search) box.
The reason why I made this digression is because I am convinced that we can find consumer insights everywhere. You just need to be a bit creative. I remember discovering Bing Ads Intelligence tool, and having one of these ah-ah moments.
This tool is by essence a brilliant search marketing tool that enables search marketers to make more informed choices when creating a campaign: based on historical and forecasted data from Bing search queries, it provides you for any keyword with traffic volumes, demographical and geographical information about the searchers, even indicative CPC for the different positions in the auction… And it is free!
If you have not downloaded it yet, I would strongly recommend you do. Even if you are not working in search marketing. In fact, I should say “especially if you are not working in search”.
This little freeware can indeed help a lot of marketers out there, especially in smaller businesses. As a matter of fact, in the current economic climate, when costs are cut to their bare minimum, can you afford to research what your audience's actual demographic profile is and where they live? Are your pockets deep enough to run a regular research to audit your brand awareness against this audience?
Search engines are for finding.
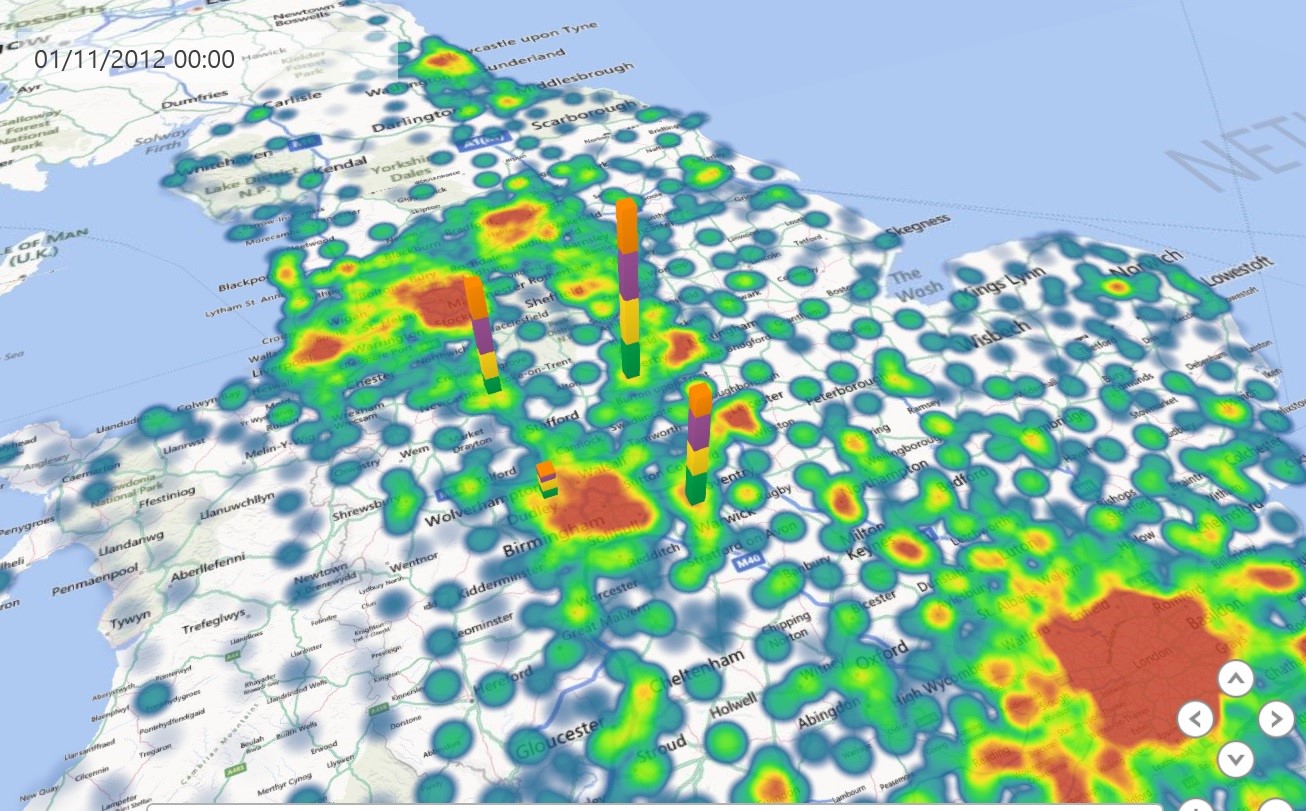
Digital expert and author John Battelle once qualified search engines as the database of intents. With more than 24m unique users in the UK alone, Bing offers you a statistically relevant sample of these intentions. So why not use the Bing Ads Intelligence to run your own piece of research? It provides you access to actual logs, so you can use them as proxy for your consumer intents. How many consumer have searched for your brand in the last month, and how many have for your competitors? That will provide you with a good indication of your brand awareness. Did they search on a PC or from a mobile device? Have queries increased after your latest local TV campaign? Was your regional billboard campaign efficient? Where are visitors searching from? London, Liverpool, outside the UK?
A lot of these questions can be answered and visualised by pressing a button in Excel. Two actually.
Two tools to make your data click
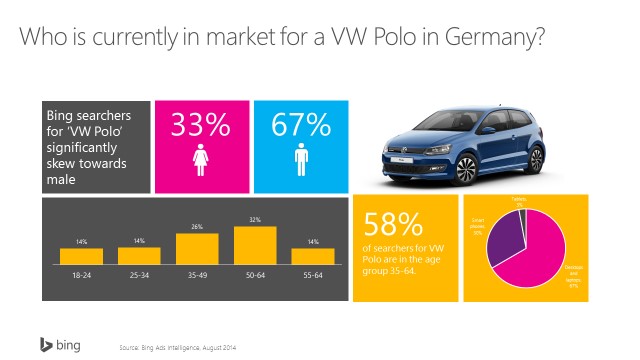
The first click should be on Bing Ads Intelligence. As said, you just have to enter a word (a brand for instance) and choose what you want to know: demographics, device usage… And since you are in Excel you can rapidly turn the data into a compelling visualisation like this:
No comments:
Post a Comment